
Repeatable lesion measurement
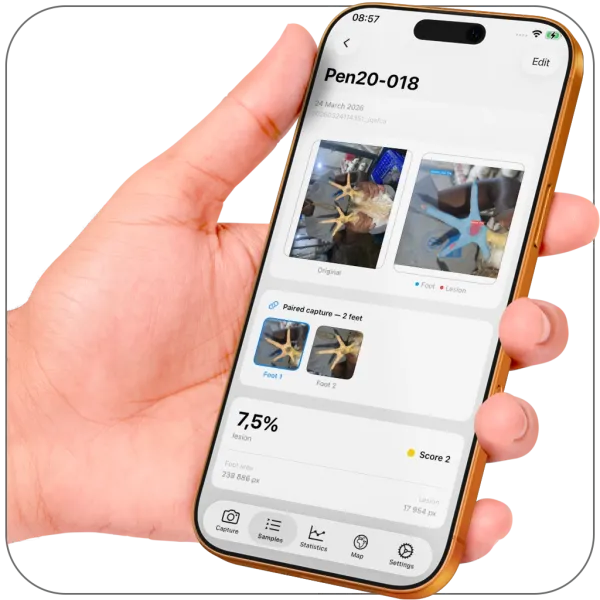
The model finds the foot outline and any lesion regions, then calculates lesion area as a share of the foot. Compare the exact percentage visit to visit instead of relying on a one-off estimate.1
Animal welfare · poultry
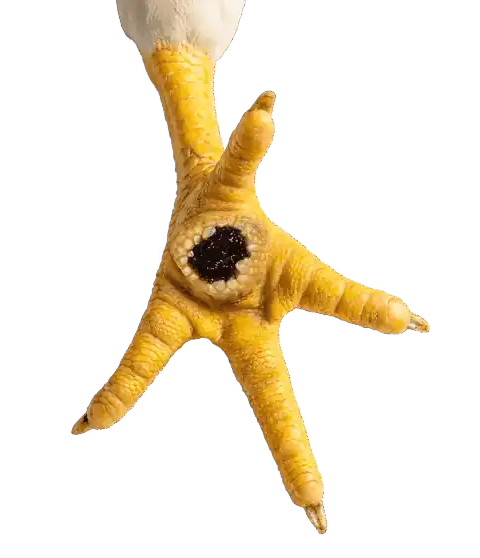
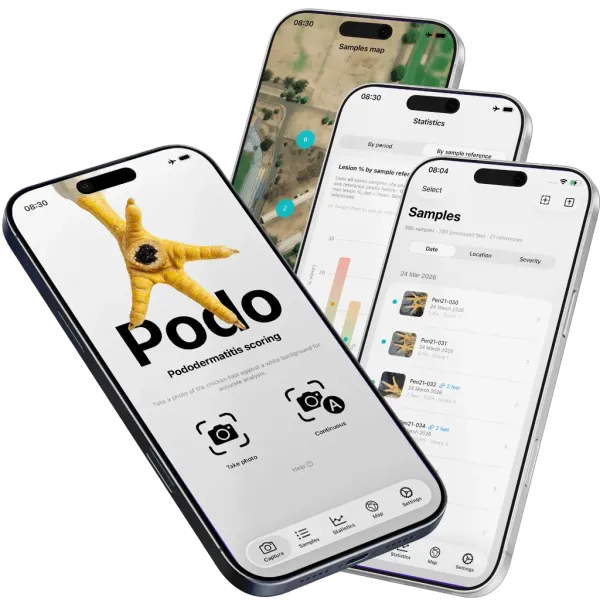
Pododermatitis causes painful foot sores that affect how birds walk and rest—and it’s one of the most-cited welfare indicators in broiler audits. Podo photographs the foot, runs an on-device AI model, and returns a consistent 0–4 welfare score and lesion percentage you can track over time and share with your team.1
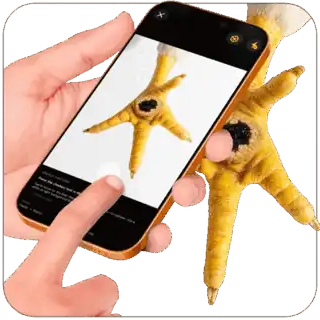
Place the foot on a plain light background, take the photo, and get a result. The same analysis pipeline runs for every user, on your device, no server required.4
The model finds the foot outline and any lesion regions, then calculates lesion area as a share of the foot. Compare the exact percentage visit to visit instead of relying on a one-off estimate.1
Results map to the standard 0–4 severity scale used in welfare audits and industry reports, so scores slot straight into your existing documentation.1
Analysis runs entirely on your iPhone or iPad—no internet required, no photos uploaded unless you choose to share them.4
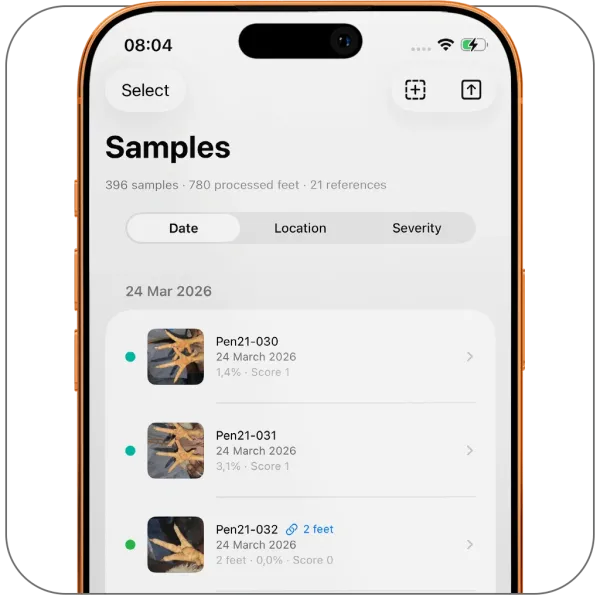
Every result is saved with its date, score, and optional GPS location. Review trends in Statistics, plot samples on the map, and compare scores across houses or visits.3
Both plans use the same on-device scoring engine—the analysis is identical.1 A subscription unlocks workflow tools and unlimited storage; it does not change the scoring itself.
| Feature | Free | Subscription |
|---|---|---|
| YOLO8n-seg segmentation and scoring on device The bundled model finds the footpad and any lesions on your phone. Core analysis runs offline without needing an internet connection. | Included | Included |
| Camera capture and single-photo analysis Photograph a foot on a light background, or analyse an existing image from start to finish in a single step. | Included | Included |
| Lesion percentage and 0 to 4 welfare-style score Lesion area is shown as a share of the foot and converted to a standard 0 to 4 score for reports. | Included | Included |
| Saved history (stored on device) Keep a running log of results and house comparisons and spotting trends over time. | Included, up to 15 saved analyses | Unlimited saved analyses |
| Import images into history Bring in existing photos from your library or Files app to analyse and save alongside new captures. | Included within the same 15-sample limit | Unlimited imports |
| Continuous capture workflow Stay in a guided flow to photograph many feet in sequence without going back to the home screen each time. | Not included | Included |
| 3D depth view (where supported) On devices that capture depth data, view a 3D overlay of the foot for extra context. | Not included | Included |
| Export from history Pull records out of the app for spreadsheets, reports, or archival copies of your scoring runs. | Not included | Included |
| Price Start for free, or subscribe monthly for unlimited history and the full set of capture and export tools. | No cost Free | Shown in app varies by region Paid monthly; price shown in the app and may vary by region |
Scoring is handled by a YOLO8n-seg instance-segmentation model compiled to CoreML—the same pipeline for every user, running entirely on your device.4 It finds the foot outline and any lesion regions, then derives the 0–4 welfare-style score from the percentage of foot area affected.1
The model outputs pixel-accurate masks for two classes—chicken foot and lesion. Polygon contours are built from those masks, smoothed for display, and areas are computed with the shoelace formula on the vertices so lesion-to-foot ratios stay consistent across visits.1

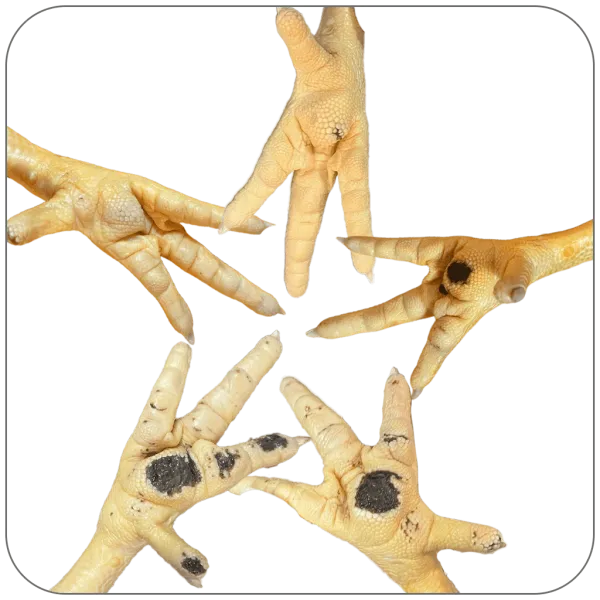
The model was trained on over 800 real broiler foot photos taken on farms and during inspections, covering a range of lighting, litter conditions and camera angles. We’re grateful to NLR and Chemuniqué for contributing a large share of those images from working production environments.
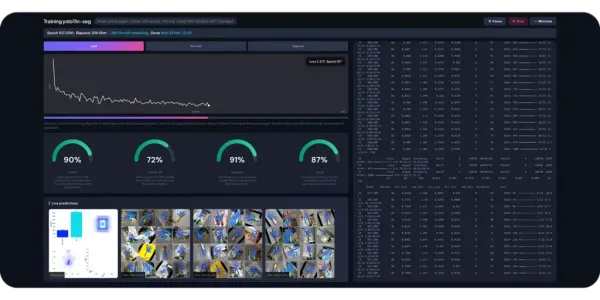
YOLO8n-seg is a compact instance-segmentation model—it identifies and outlines objects at pixel level, not just a bounding box.1 We fine-tuned it to distinguish two classes—healthy foot tissue and lesion—then compiled the result to CoreML to run on the Apple Neural Engine inside your device.
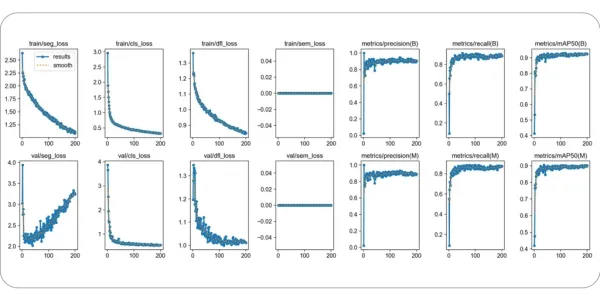
After training, the model was tested on 98 images it had never seen. It correctly found and outlined feet and lesions roughly 87–90% of the time, and captured around 84–87% of the total affected area across those images. These figures are a baseline from our validation set; real-world accuracy depends on capture quality and conditions.2
Podo does one thing well: objective pododermatitis scoring from a single photo. Spend less time debating whether the last check was done right, and more time acting on what you find.3
Limited offer
3 months free on Podo
Try the full subscription — unlimited history, continuous capture, export, and more — completely free for three months.
Redeem free trial